[ FreeCourseWeb.com ] Learn Excel Data Analysis with Interactive Excel Dashboards
Download More Latest Courses Visit -->> https://FreeCourseWeb.com
MP4 | Video: AVC 1280x720 | Audio: AAC 48KHz 2ch | Duration: 5.5 Hours | Lec: 48 | 3.28 GB
Genre: eLearning | Language: English
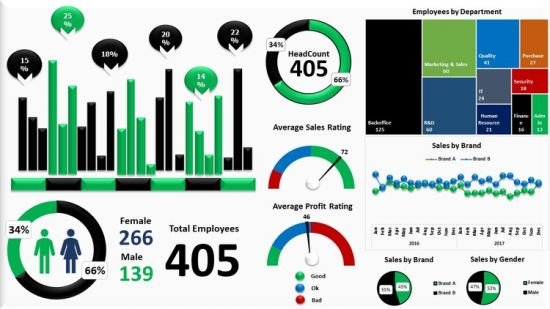
Create 6 Excel Dashboards - Learn Excel Data Analysis & Data Visualization with Pivot Tables, Pivot Charts & Slicers
Excel Dashboard- Excel Data Analysis and Data Visualization with Excel Pivot Tables, Excel Pivot Charts and 6 Interactive and Dynamic Excel Dashboards. Microsoft Excel 2010, Excel 2013 and Excel 2016.
Excel Charts and Excel Graphs are one of most powerful features of Microsoft Excel which allows the users to represent numerical data in Graphical Data Visualization format so that end user gets a better view of the Information discussed.
In this course
Use Winrar to Extract. And use a shorter path when extracting, such as C: drive
Download More Latest Courses Visit -->> https://FreeCourseWeb.com
Get Latest Apps Tips and Tricks -->> https://AppWikia.com
We upload these learning materials for the people from all over the world, who have the talent and motivation to sharpen their skills/ knowledge but do not have the financial support to afford the materials. If you like this content and if you are truly in a position that you can actually buy the materials, then Please, we repeat, Please, Support Authors. They Deserve it! Because always remember, without "Them", you and we won't be here having this conversation. Think about it! Peace...